When I first started working seriously with R for data analysis, the biggest time drain wasn’t modeling or interpretation; it was everything around it.
Reading the same CSVs, cleaning similar datasets, rewriting EDA plots, I’d already built dozens of times. None of it was difficult, but all of it was repetitive.
Tools like Cursor earn their place here, handling the repetitive parts of the workflow so I can focus on decisions that actually matter.
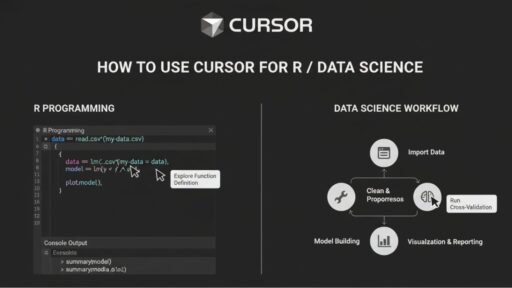
In this guide, I’ll share how I use Cursor alongside R for day-to-day data science work. We’ll cover each stage step by step: setup, reusable scripts, EDA, modeling, and reporting. I’ll also highlight where Cursor adds real efficiency. Let’s get into the details!.
Cursor For R / Data Science – TL;DR
Step 1 – Install & Configure:
- Install R from CRAN and ensure it works (R, Rscript, Rtools as needed).
- Download and install the Cursor IDE from the official site.
- Open your R project or scripts directly in Cursor (or use the Cursor CLI from your terminal).
Ask Cursor to generate a small R snippet to confirm everything is working, for example:
“Write R code to load a CSV, remove NAs, summarize data, and create a ggplot histogram.”
Step 2 – Generate Scripts:
- Use Cursor to generate R code for tasks like read.csv(), ggplot2 plots, and data cleaning pipelines.
- Remember: Cursor generates code based on prompts — you can review and adjust as needed.
Step 3 – Reuse & Automate:
Save templates for recurring tasks. Example:
# Reusable snippet generated via Cursor prompt
# Cursor-generated snippet
data <- read.csv("sales_data.csv")
data <- na.omit(data)
summary(data)Step 4 – Review & Execute:
- Always validate generated code in your R environment.
- Adjust parameters, libraries, and variable names before running full scripts.
Note: Cursor assists in code generation, but you review and refine all outputs for accuracy and project-specific requirements.
How I Set Up Cursor for R Without Wasting Time
Getting Cursor set up properly is less about clicking “install” and more about avoiding friction later. A rushed setup usually shows up weeks down the line, broken snippets, missing libraries, or code that doesn’t match how you actually work in R.
I treat setup as a one-time investment. Let me walk you through the steps I follow to install, configure, and optimize Cursor so it fits seamlessly into my R workflow.
Step 1: Install Cursor and Verify It Works
Start by downloading the latest version of Cursor from the official site. Before opening it, make sure your R installation is current and stable. Mismatched versions are one of the most common causes of early frustration.
Once Cursor is installed, open your R project directly in the Cursor IDE (which is VS Code–style) or use the Cursor CLI from your terminal.
To verify everything is working, you can run a small test prompt in Cursor’s chat. For example:
“Write R code to load a CSV, remove NAs, summarize the data, and create a ggplot histogram.”
Note: In this article, cursor_generate(“…”) is pseudocode for “ask Cursor with this prompt” — it’s not an actual R function.
If the generated code is clean and runs correctly in your R environment, you’re good to go.
Step 2: Configure Cursor to Match Your Workflow
This is where most people stop, and where I suggest spending a few extra minutes.
- Default Libraries: Set commonly used libraries like dplyr, ggplot2, and data.table as defaults in Cursor. This avoids repeatedly loading packages in generated scripts.
- Snippets & Templates: Customize code templates for repetitive tasks, such as CSV import or EDA summaries. Templates save time and standardize your code style.
- IDE Integration: Adjust settings to ensure Cursor suggestions appear in your code editor without interruption. Enable syntax highlighting for generated snippets.
These configurations help you work faster while maintaining clean, reproducible R code.
Avoid These Setup Mistakes with the Cursor
Even with a clean install, a few issues come up regularly:
- If your R console or R extension isn’t working inside Cursor (or VS Code), check your R installation path and which version your editor is using.
- If you juggle multiple R versions, make sure your PATH / R extension points to the version you want; Cursor will generate code for whichever R environment you run.
Once these are sorted, the Cursor tends to stay out of the way, which is exactly what you want from a productivity tool.
Also Read: How To Use Cursor For Data Engineering?
My Step-by-Step R Workflow with Cursor
When I approach a new R project, I follow a structured workflow. Cursor handles the repetitive coding chores that usually slow me down. Over time, this workflow has become second nature, and it keeps my projects consistent and reproducible.
Here’s how I break down each stage, from importing data to reporting insights, while letting the Cursor streamline the repetitive parts.
Step 1: Import Data Quickly and Consistently
Importing data correctly sets the tone for everything else. I often deal with multiple CSVs or Excel sheets, and manually writing import code for each one quickly becomes tedious. Using Cursor, I generate standardized code to load datasets, handle missing values, and preview results. For example:
# Cursor-generated snippet
library(readr)
sales_data <- read_csv("sales_data.csv")
head(sales_data)Before trusting any automated snippet, always inspect column types, check for missing values, and verify sample rows. This small habit prevents messy surprises later.
Step 2: Clean and Transform Data Without Rewriting Code
Raw data almost always needs some cleaning. Over the years, I’ve noticed recurring patterns: removing NAs, converting factor types, and standardizing column names. Cursor helps by creating reusable snippets for these steps:
- Remove Missing Values:
clean_data <- na.omit(sales_data)- Convert Factor Types:
clean_data$Region <- as.factor(clean_data$Region)- Standardize Column Names:
names(clean_data) <- tolower(names(clean_data))You can save these snippets as templates. This ensures consistency across projects and allows me to focus on more complex transformations when they arise.
Step 3: Generate EDA Insights Fast
EDA is where I start understanding the story behind the numbers. Rather than manually coding each plot, I rely on Cursor to generate consistent visualizations and summary statistics:
library(ggplot2)

# Generate distribution plot
ggplot(clean_data, aes(x = Sales)) +
  geom_histogram(binwidth = 1000) +
theme_minimal()Cursor also allows you to summarize key statistics:
summary(clean_data)These generated snippets speed up insight generation while maintaining consistency in visualization style.
Step 4: Build Models Using Ready-to-Use Templates
Once the data is clean and understood, modeling comes next. Cursor can help scaffold common analysis templates like linear regression or classification:
# Linear regression template
model <- lm(Sales ~ MarketingSpend + Region, data = clean_data)
summary(model)For classification tasks, Cursor can generate examples using decision trees or logistic regression. You can also produce cross-validation code templates to ensure models are tested properly before deployment.
Step 5: Automate Reports and Visualizations
After modeling, the goal is sharing results efficiently. Cursor simplifies the creation of export-ready datasets and visualizations:
# Export cleaned dataset
write.csv(clean_data, "clean_sales_data.csv")You can also automate plot saving:
ggsave("sales_distribution.png")These steps save time and ensure reproducibility. It also prevents last-minute errors when sharing reports with stakeholders.
Quick Checklist for Every R Project
1. Verify Data Import Ensure all datasets loaded. Check column names and types. Preview first rows with head() or glimpse(). Ensure all datasets loaded. Check column names and types. Preview first rows with head() or glimpse().2. Clean and Transform Data Remove or fill missing values. Standardize names and data types. Apply transformations consistently. Test changes on a small sample.3. Exploratory Data Analysis (EDA) Generate basic statistics. Create quick plots (histograms, scatterplots, boxplots). Spot anomalies or outliers. Check that results make sense for the project.4. Save Reusable Code & Templates Save repeated steps in functions. Keep templates for future projects. Add comments for clarity. Use Git to track changes.5. Validate Outputs Compare results with raw data. Ensure plots and summaries are accurate. Run scripts end-to-end without errors. |
How Much Time Cursor Really Saves
| Task | Traditional Time | Cursor Time Saved |
| Data cleaning (100k rows) | 20 min | 7 min |
| Plotting & EDA | 15 min | 5 min |
| Script generation | 10 min | 3 min |
Note: These numbers are based on internal/example projects and are meant as illustrative benchmarks. Your actual results will vary by codebase, infrastructure, and team.
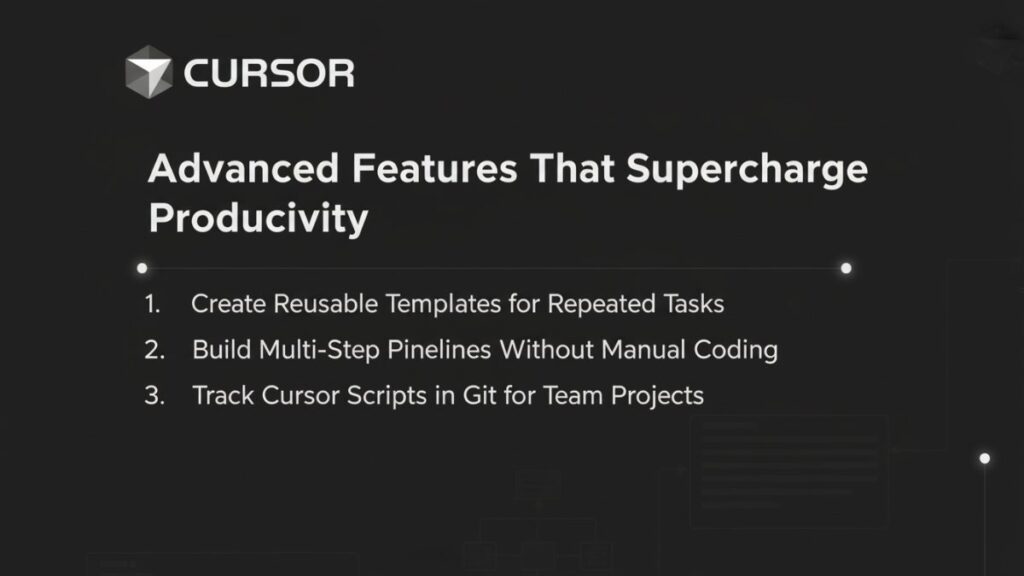
Advanced Features That Supercharge Productivity
Once I got comfortable with the basics, I started exploring Cursor’s advanced features. These are where the tool really starts saving time, especially on larger projects or collaborative work.
I treat Cursor as a personal assistant that handles repetitive pipelines, so I can focus on interpretation and strategy. Let’s break down these advanced capabilities and see how they fit into a structured workflow that actually saves time.
1. Create Reusable Templates for Repeated Tasks
One of the most powerful features is creating project-specific templates. For instance, I frequently work with multiple CSV files that need the same cleaning and merging steps. I built templates like this:
# Template for importing multiple CSV files
file_list <- list.files(path = "data/", pattern = "*.csv", full.names = TRUE)
data_list <- lapply(file_list, read_csv)
combined_data <- do.call(rbind, data_list)Having these templates means I can reuse them across projects, maintain consistency, and avoid the small errors that creep in when rewriting similar code repeatedly. I also include standard visualizations or summaries in these templates, so I rarely start from scratch.
2. Build Multi-Step Pipelines Without Manual Coding
For more complex workflows, Cursor allows sequential code generation. For example, I might prompt it to:
- Load a dataset
- Clean missing values
- Generate summary plots
- Prepare data for modeling
This produces a sequence of ready-to-review snippets that I can tweak as needed. For me, this reduces friction when building pipelines without stripping away control over the analysis.
cursor_generate("load CSV, remove NAs, summarize, create ggplot histogram")Cursor will produce code for all these steps, which you can review and customize. This helps in building pipelines without manually scripting each stage.
3. Track Cursor Scripts in Git for Team Projects
Cursor works seamlessly with version control, which is crucial in team environments. I commit generated scripts to repositories, track changes collaboratively, and maintain versioned runbooks. For example:
git add data_cleaning.R
git commit -m "Added Cursor-generated data cleaning pipeline"This ensures that all automated scripts are reviewed, tracked, and safely integrated into the team’s workflow. It also makes rolling back or updating processes much easier.
Also Read: Cursor For Code Refactoring
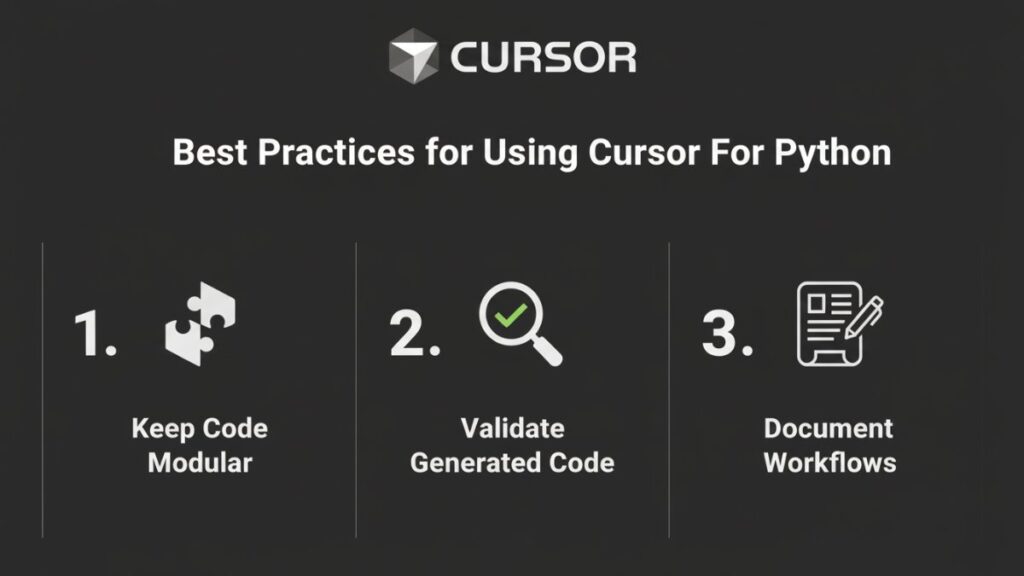
My Best Practices for Using Cursor Effectively
In my experience, the difference between a Cursor-assisted project that runs smoothly and one that becomes messy isn’t the tool itself; it’s how you structure your workflow. Following a few disciplined habits makes Cursor a real productivity booster instead of just a code generator.
1. Keep Code Modular
I’ve learned that splitting work into functions and small scripts is invaluable. Not only does it make code readable, but it also simplifies debugging and future modifications. Cursor makes creating reusable functions effortless, which I rely on heavily for repeated tasks like cleaning or transforming datasets.
Example:
# Modular function for cleaning datasets
clean_dataset <- function(df) {
  df <- na.omit(df)
  names(df) <- tolower(names(df))
  return(df)
}

cleaned_data <- clean_dataset(raw_data)Once this function is templated in Cursor, I can apply it across multiple projects without rewriting anything, saving time while keeping scripts organized and consistent.
2. Validate Generated Code
Even though Cursor produces functional snippets, I never run a full script blindly. Step-by-step validation prevents small issues from snowballing into bigger problems. My checklist usually includes:
- Inspecting variable names and data types
- Checking intermediate outputs
- Confirming that plots and summaries match expectations
# Check first few rows
head(cleaned_data)
# Verify column types
str(cleaned_data)Taking these small validation steps has saved me from countless headaches when scaling up to larger datasets.
3. Document Workflows
Documenting your workflow ensures reproducibility and makes collaboration easier. Cursor allows you to add inline notes and save versioned runbooks.
Tips:
- Add comments explaining each generated block
- Maintain runbooks in a dedicated folder, e.g., /runbooks
- Track changes using Git or similar version control
Example:
# Step 1: Import CSV files
# Generated by Cursor
sales_data <- read_csv("sales_data.csv")Well-documented workflows make it easier to revisit, update, and share projects with colleagues.
Also Read: BMAD Method
Final Words
Cursor has become my go-to assistant for repetitive R tasks. It doesn’t replace thinking or analysis, but it handles the mechanical parts that usually slow me down.
I rely heavily on templates and reusable snippets. They standardize processes and reduce mistakes. Advanced features, like multi-step prompts and Git integration, make it easy to scale projects and collaborate with others.
The key is discipline. I always keep my code modular, validate every snippet, and document workflows. These habits ensure reproducibility and prevent errors from creeping in.
In short, Cursor is an amazing productivity enhancer. Combined with careful review and best practices, it can easily make R projects faster, cleaner, and easier to manage.
Save Hours on Data Cleaning and Analysis in R
Implement Cursor workflows faster with the R Data Science Runbooks Pack. It provides structured, copy-paste-ready scripts that save time and reduce repetitive coding. Follow tested templates to handle data import, cleaning, EDA, and visualization efficiently.
Key Features:
- Includes step-by-step templates for CSV imports, cleaning, and exploratory analysis
- Get 3+ modeling templates for regression, classification, and cross-validation
- See examples of reusable visualizations and automated reporting
- Follow best practices for modular, documented workflows
Ideal for R developers, data analysts, and data science learners seeking faster, reproducible workflows.
Frequently Asked Questions (FAQs)
Can Cursor work with all R packages?
Cursor can generate code using the most widely used CRAN packages (dplyr, ggplot2, data. table, etc.). For niche packages or unusual APIs, you may need to guide it with examples from the package documentation.
Is Cursor suitable for large datasets?
Yes, Cursor can generate efficient R scripts for datasets of varying sizes. For very large datasets, you may still need to optimize memory usage or use chunked processing, but Cursor helps reduce repetitive coding and speeds up workflow.
Can I customize Cursor-generated scripts?
Absolutely. Every script Cursor produces is fully editable. You can tweak variables, adjust parameters, or add new steps to match your project requirements, making the code reusable across multiple analyses.
Does Cursor integrate with RStudio?
Cursor doesn’t plug directly into RStudio. Typically, you:
– Open your R project in the Cursor IDE to generate and edit code.
– Run the code in RStudio, R console, or terminal if desired.
You can keep RStudio open for plotting or console work while using Cursor for AI-assisted editing.